Where does the USD have the most purchasing power?
| Country | Income Group | USD Purchasing Power |
|---|---|---|
| Russia | High income | $3.19 |
| Belarus | Upper middle income | $3.93 |
| Egypt | Lower middle income | $6.40 |
| Sierra Leone | Low income | $4.44 |
Countries with the highest USD purchasing power by income group (2023).
Comparing the Russian Ruble to the US Dollar
This morning I was reading about a Ukrainian drone strike on several Russian oil refineries, which supposedly disrupted 15% of Russia's oil refining capacity . Given the events taking place in recent years, I got curious about the value of the Russian ruble relative to the US dollar. I decided to look up the exchange rate.
This isn't the first time I've done this, but it's the first time I've ever thought about the result. I know that as of today
1.00 USD = 98.23 RUB
, however, one ruble does not buy you a drink
(okay, one and some change)
. So this isn't really the metric I'm looking for.
After some research, I found another metric called PPP
(Purchasing Power Parity)
. As far as I understand, PPP is the amount of a foreign currency needed to match the same purchasing power as one US dollar. As of the time of writing the ruble's PPP conversion rate is
29.18 RUB
. Dividing the exchange rate by the PPP, it seems
1.00 USD = 3.36 USD
in Russia today. This is called the RER
(Real Exchange Rate)
.
Finding where the USD has the most Purchasing Power
This is really cool! It gives me the context I've been looking for, and failing to find, every time I've compared the US dollar with a foreign currency. Naturally, the next thing I want to know is where the dollar is worth the most. I searched for PPP data via Google's
dataset search
and found the World Bank's
data page
. From here I downloaded the
PA.NUS.FCRF
and
PA.NUS.PPP
datasets. Please note that
the latest year in these datasets is 2023
.
Code
import pandas as pd

# Load dataset data.
fx = pd.read_csv("fx.csv", usecols=[0, 67], names=["name", "exchange_rate"], header=0)
ppp = pd.read_csv("ppp.csv", usecols=[0, 67], names=["name", "ppp_rate"], header=0)
meta = pd.read_csv("metadata.csv", usecols=[2, 4], names=["income_group", "name"], header=0)

# Merge on country name.
df = fx.merge(ppp, on="name").merge(meta, on="name").dropna()

# Calculate real exchange rate.
df["real_exchange_rate"] = df["exchange_rate"] / df["ppp_rate"]

# Sort by income group and real exchange rate.
income_group_order = {
    "High income": 1,
    "Upper middle income": 2,
    "Lower middle income": 3,
    "Low income": 4,
}
df["income_order"] = df["income_group"].map(income_group_order)
df = df.sort_values(["income_order", "real_exchange_rate"], ascending=[True, False]).drop(columns=["income_order"])

# Export to CSV.
df.to_csv("rer.csv", index=False)
Result
You can download the CSV here .
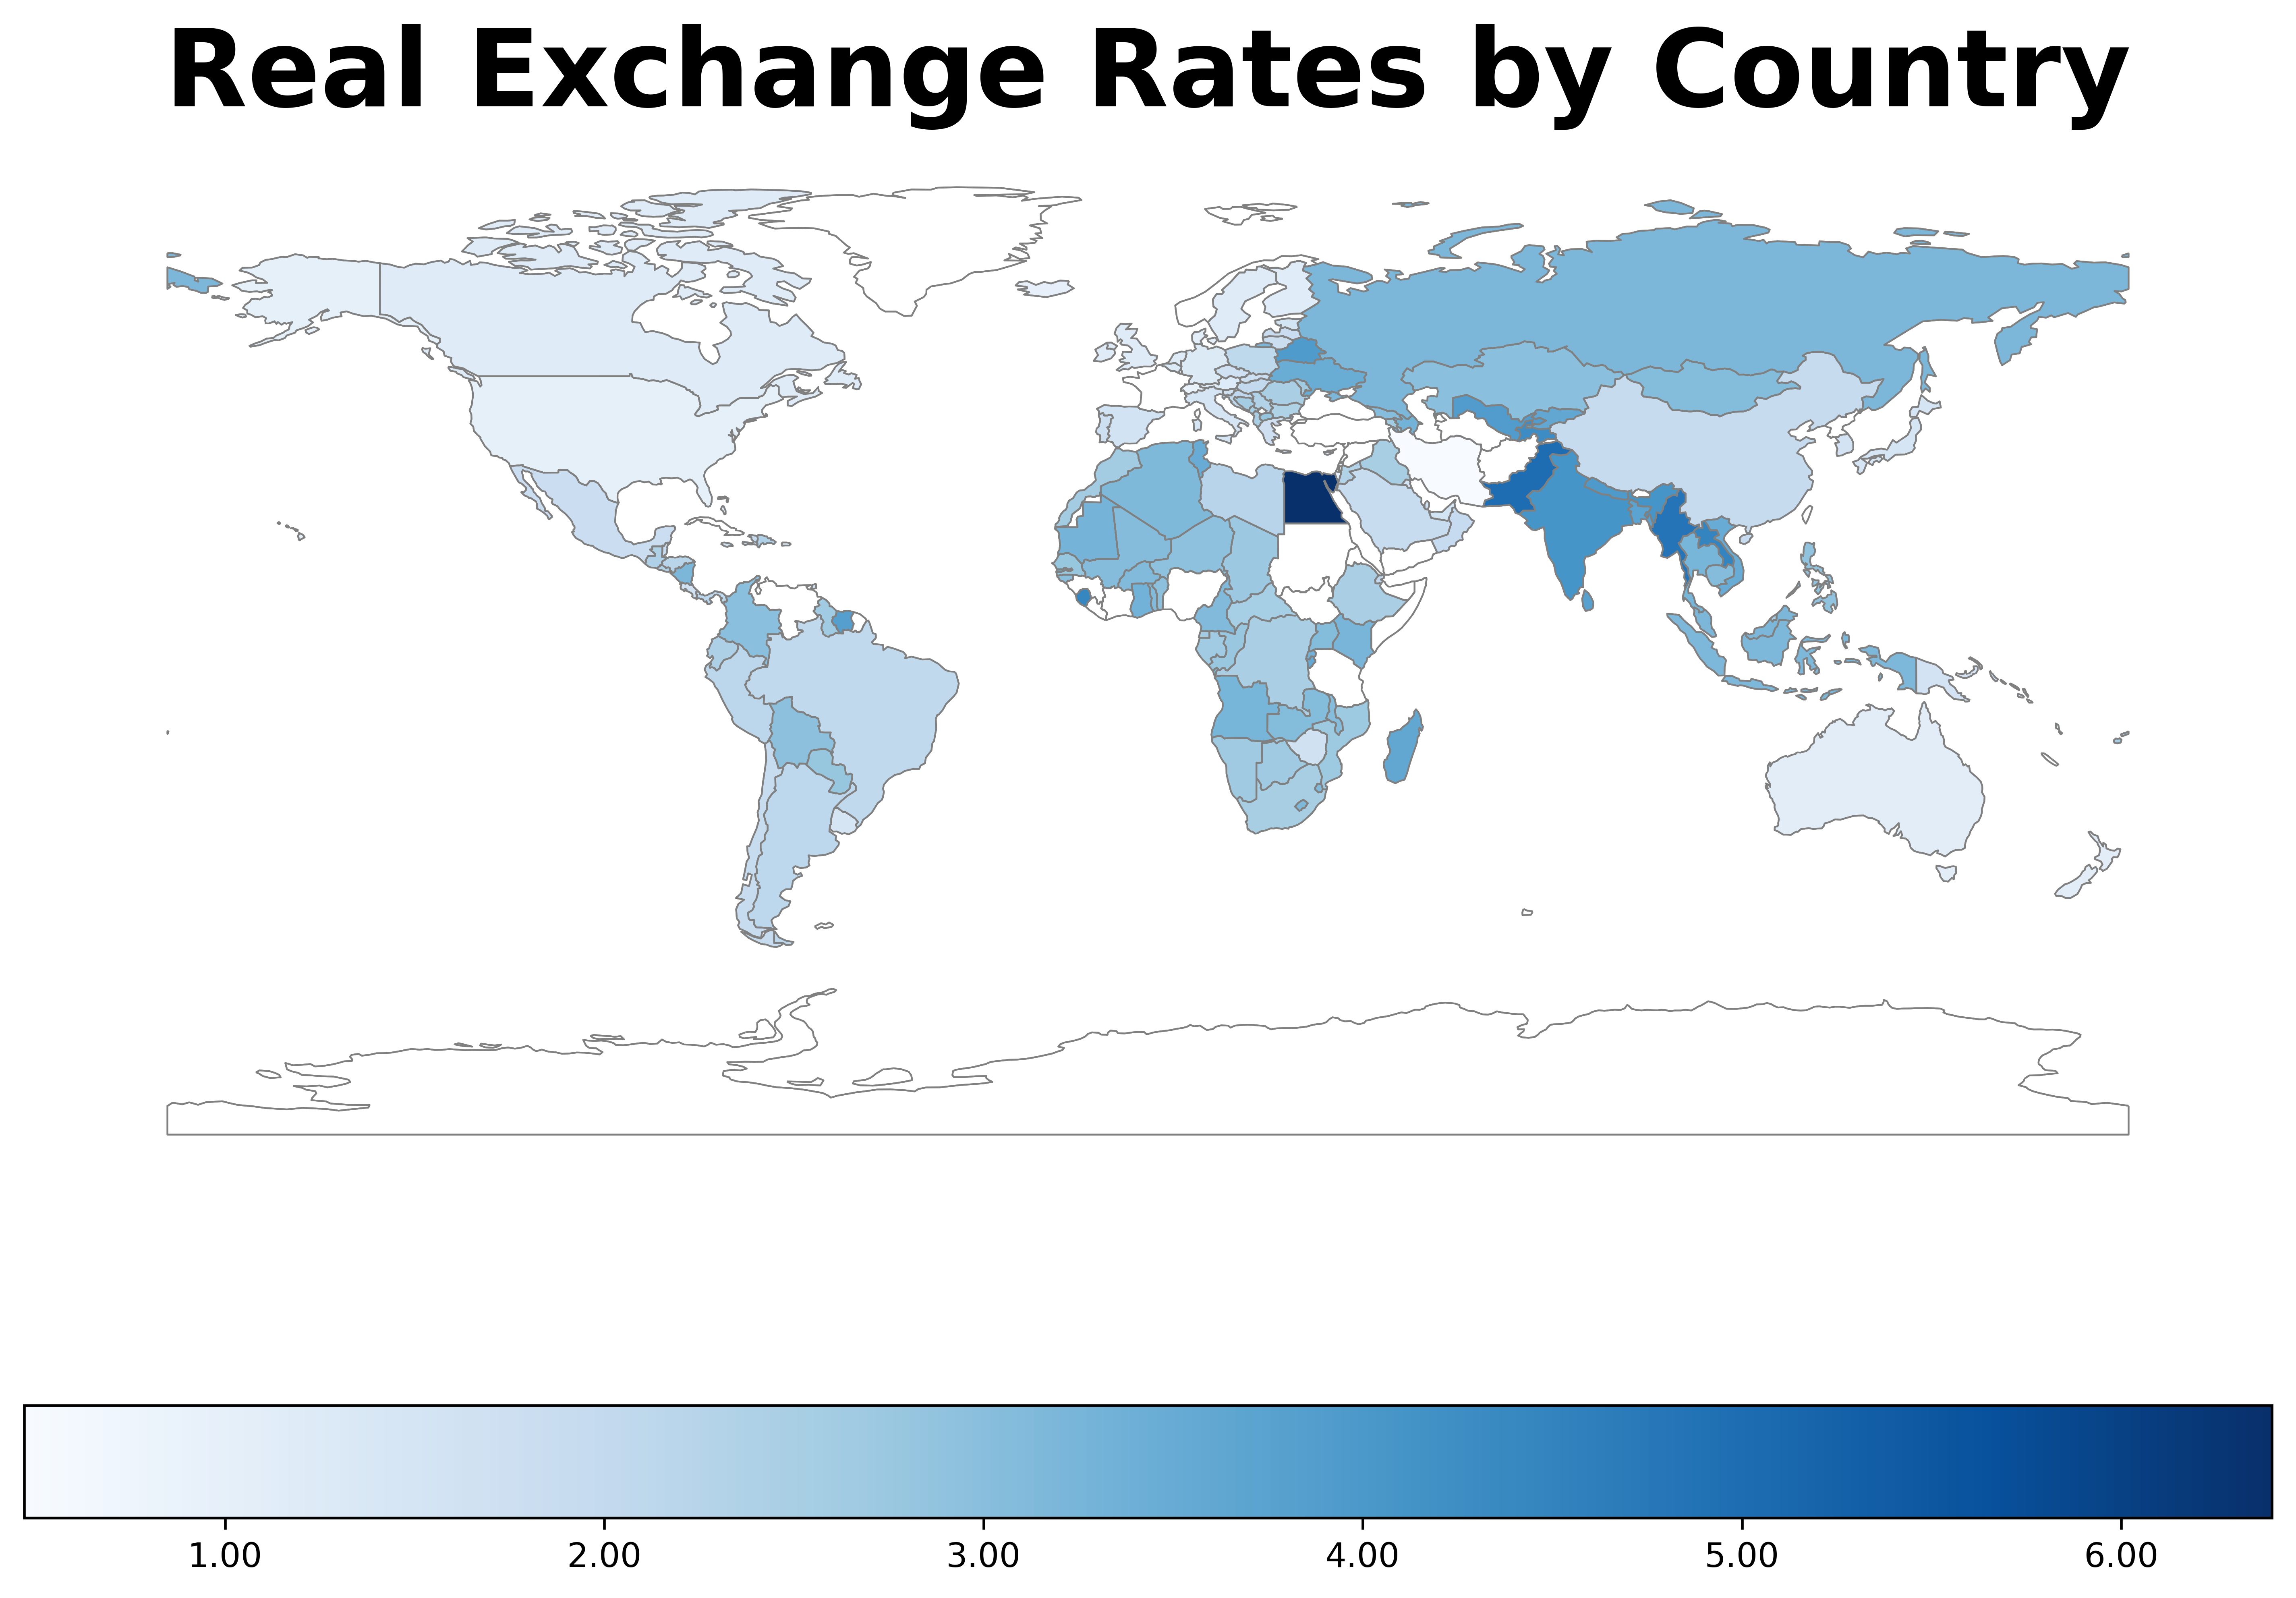
A nice map my co-worker suggested I make. Thanks Joe!